
ENERGY DATA
The collection and analysis of data are fundamental for scientific research and problem-solving, so here we present a breakdown of some data on energy consumption by energy source, geographic area, and economic sector. The data we show here are courtesy of BP Energy Outlook 2035 published in February 2015, and BP Statistical Review of World Energy from June 2015. This does not mean that the Penn EnerFront group endorses, or is endorsed by, BP. In future, this page may feature data from other sources as well.
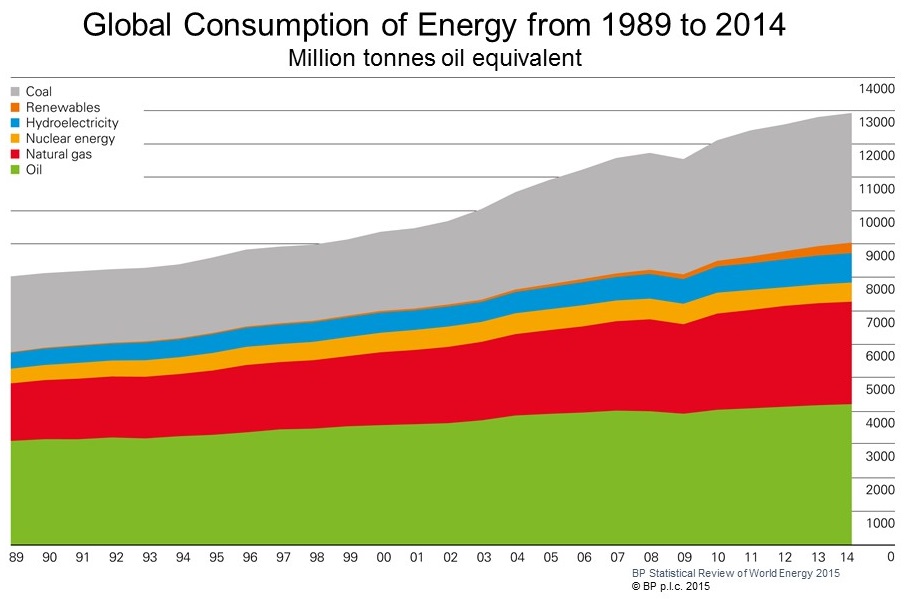
Let us start with a big picture: the usage of various energy types around the world in recent past (1989-2014). The graph below presents how the global consumption of energy changed across the span of 25 years. In order to avoid any potential ambiguities, here are a few clarifications before we move on to the analysis of these data. First of all, energy quantities shown here refer to energy in its final form, that is, the form which can be readily used by humans. Second, the tonne (1,000 kilograms) of oil equivalent, which is the physical unit in which energy is expressed here, is the amount of energy that is released when a tonne of crude oil is burned. This amount of energy can vary slightly depending on the type of crude oil, but roughly it is equal to 42 billion joules. For comparison, the same amount of energy can support the daily metabolic needs of approximately 4,000 people. (Of course, this is just a crude estimate, since people’s metabolic requirements can vary quite a bit.) Or, an equal amount of energy could keep close to 5,000 old-fashioned (aka incandescent) light bulbs (each consuming the power of 100 watts) shine for an entire day. Note that, although our examples imply different forms of energy (burning of oil releases heat or thermal energy; human bodies run on chemical energy; light bulbs are powered by electric energy), they can all be expressed in the same physical unit, in this case the tonne of oil equivalent. The values for nuclear and hydroelectric energy, as well as for other renewable energy sources (wind, waves, solar and geothermal energy, solid biomass, liquid biofuels, landfill gas and combustible waste) have been derived by calculating the quantity of crude oil required to generate the equivalent amount of electricity in a thermal power station, assuming the conversion efficiency of 38%.
The tonne of oil equivalent (toe) is the amount of energy released when a tonne (1,000 kg) of crude oil is burned, roughly equal to 42 billion joules.
Now that we have clarified this, let us turn our attention back to the data. The first graph shows that the world energy consumption has been increasing over recent 25 years, and this growth has been based mostly on non-renewable, fossil fuels (coal, oil and natural gas). This global growth in energy usage should not surprise us, as we know that in the long run the world economy has grown, and that it is based on technologies that require a lot of energy. This link between the size of global economy and the global energy usage is reflected in a notable dent in the world energy consumption that happened during the recent economic crisis (2008-2009).
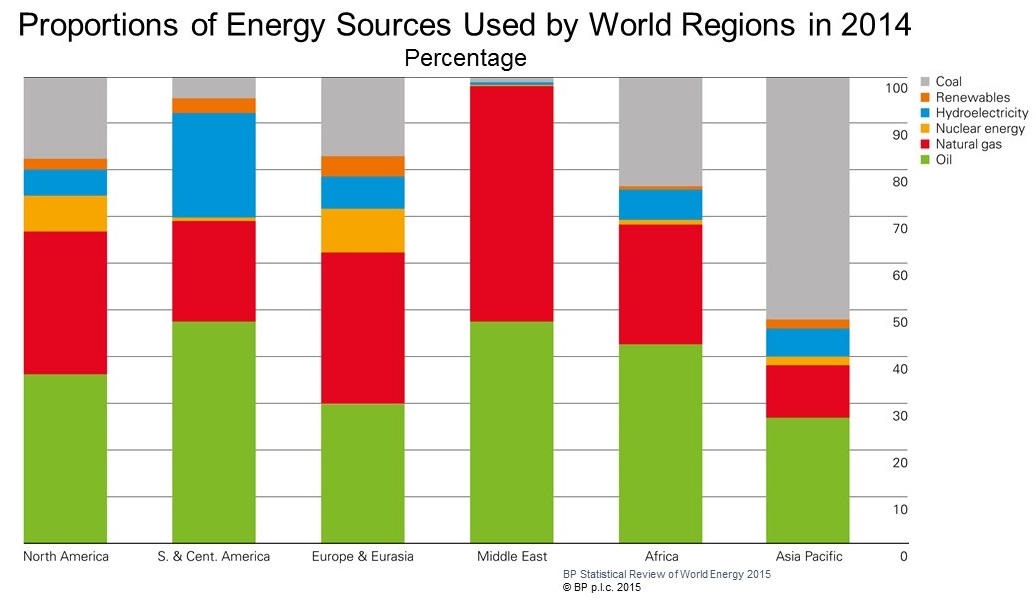
The following graph focuses on the relative contributions of different energy sources to the total energy consumption in six large regions of the world during 2014.
North America: Canada, the United States and Mexico.
South & Central America: All Latin American countries except Mexico, including the Caribbean.
Europe & Eurasia: All European countries, Turkey and the former Soviet Union.
Middle East: Arabian Peninsula, Iran, Iraq, Israel, Jordan, Lebanon and Syria.
Asia Pacific: Countries that belong to none of the other five regions. Among others, it includes China, India, Japan and Australia.
While fossil fuels dominate energy consumption in each of the regions, the Middle East is practically entirely dependent on natural gas (~50%) and oil (close to 50% of total energy usage). Proportionally the least gas is used in the Asia Pacific area, which instead is the region that uses by far the most coal (above 50% of its overall energy needs). On the other hand, South and Central America meets a larger share of its energy needs in the form of hydroelectricity and other renewables combined than any other region (above 20%). In comparison with South and Central America, Eurasia uses a significantly smaller proportion of hydroelectricity (~6-7% of the regional total – similar to North America, Africa and Asia Pacific), but somewhat larger (world’s largest) proportion of other renewables, although this is still quite a small percentage. Eurasia also leads in the relative consumption of nuclear energy, with countries like France, Russia, Germany, Ukraine, Sweden, the UK and Spain dominating in this respect. Besides Eurasia, North America is the only other region that uses a significant proportion of nuclear energy. All in all, the world has a long way to go before achieving energy sustainability.
Let us have a look at anticipated future energy consumption of the world. The next graph presents historical data (1965-2012) on percentage proportions of energy sources in total energy usage around the world, and how those percentages have been expected to change by 2035. A few notes are due here: This future projection was done by BP, and other sources would most likely come up with a different forecast. Such forecasts are highly dependent on the underlying assumptions on, for example, future population and economic growth, and on the mathematical descriptions that relate these assumptions to energy consumption. All these things are uncertain, so each such forecast (including this one, and all the others we present below) should be taken with a grain of salt.
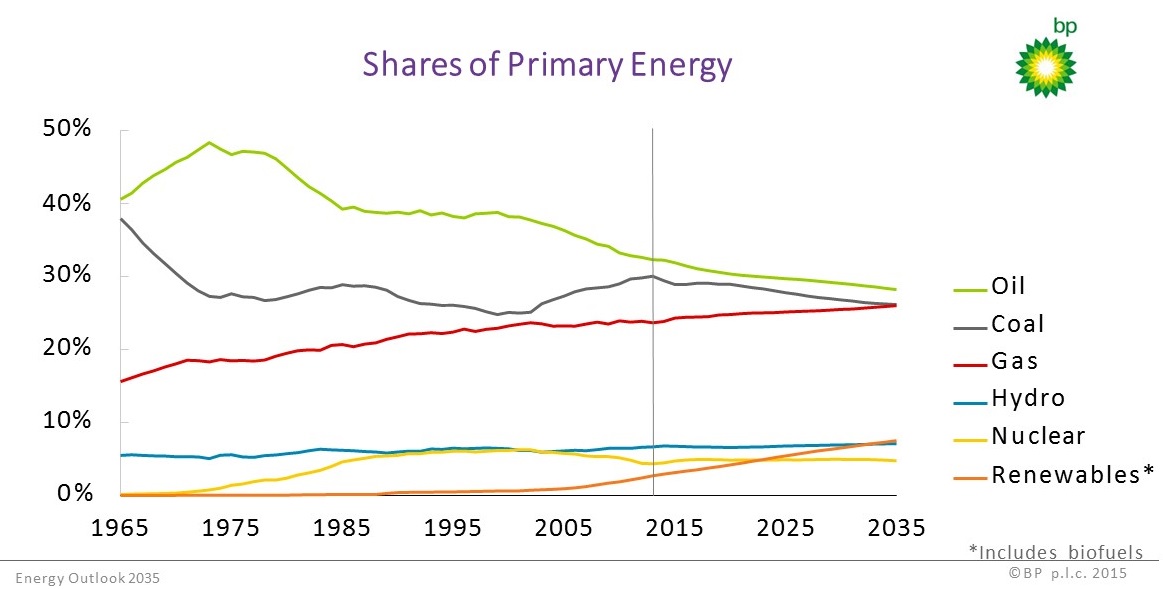
According to this projection, in 2035 fossil fuels will still greatly dominate global energy consumption (81% of totally consumed energy), although to a smaller degree than in 2012 (86%), and with an increased proportion of gas relative to coal and oil. The anticipated relative growth in the consumption of natural gas can be related to the fact that it releases the least amount of the greenhouse gas CO2 of all fossil-fuels, so environmental policies aimed at reducing CO2 emissions (and hence global warming) are likely to be less restrictive to gas than to oil and especially coal (the most polluting fossil fuel). Most of the predicted drop in the percentage of fossil fuels within the total amount of energy consumed by the world is explained by the projected rise in the percentage consumption of renewables (not including hydroelectricity) from ~3% in 2012 to ~8% in 2035. They are expected to overtake the share of nuclear energy in the total consumption in the early 2020s, and reach about the same share as hydroelectric energy in 2030s. However, according to this forecast, in 2035 the world will still be far from reaching energy sustainability.
One thing that makes this goal so difficult to achieve is a tremendous growth in the global energy consumption. The two graphs that follow present the world’s energy usage by economic sector and energy source in tonnes of oil equivalent (toe) that was observed in the past few decades (1965-2012) and that is expected to happen by 2035. Before going into the details, let us draw your attention to one striking feature in these graphs: The world’s energy consumption had nearly quadrupled between 1965 and 2012! Moreover, in 2035 it is forecast to be 50% (that is, ~6 billion toe) larger than in 2012! The bar for reaching energy sustainability is being raised higher and higher! We will shortly give reasons for this, but first let us spend some time on analyzing the energy demand across economic sectors, and how this compares with the consumption of energy from various sources (the latter is the same data as shown in the graph immediately above, but in absolute terms, rather than percentages).
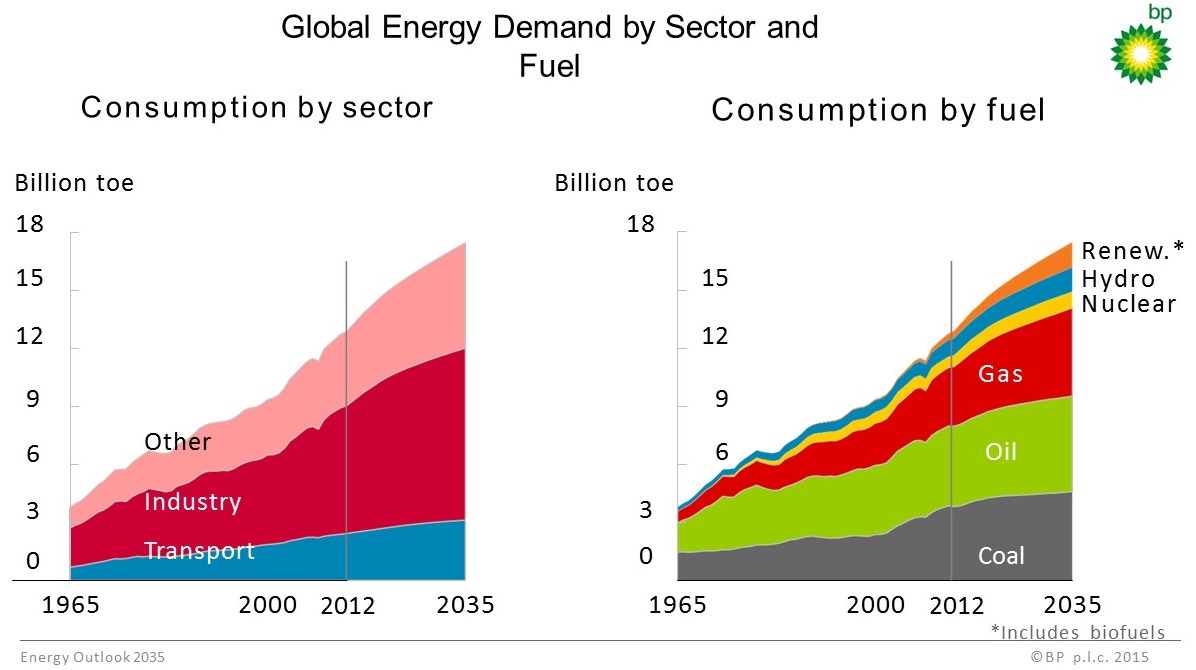
Industry has always taken the largest share of energy, and will very likely continue to do so in the next decades. Transport has been consuming the relatively smallest amount of energy, and its energy usage is projected to undergo the relatively smallest growth among the economic sectors. The ‘other’ sectors, namely, residential, services and agriculture sectors lumped together, are intermediate energy users, but are forecast to have the largest growth in energy consumption by 2035. These forecasts reflect the expected values of the future growth of a given economic sector. The breakdown of global energy consumption by energy source shows, both in the data from 2012 and in the forecast for 2035, that the industrial usage of energy roughly equals the consumption of oil and gas together, while the combined energy demand of transport and all other economic sectors is equivalent to the combined consumption of coal, nuclear and renewable energy, including hydroelectricity.
Why has the global energy consumption grown so massively, and why is it predicted to continue the rapid growth in the coming decades? The main drivers of this growing demand for energy are human population growth and increases in the economic output (known as gross domestic product – GDP, or in this particular case gross world product – GWP) per person over time. Between 1965 and 2012, the world population had roughly doubled, from close to 3.5 billion to about 7 billion people. An increase in population generally means a rise in demand for resources and services, which translates into economic growth, and this involves a growing energy consumption. If no other change had happened except the doubling of global population, that is, if the economic productivity per person and the energy use per GWP had remained the same, we would expect to see a doubling in global energy consumption. However, as we have observed previously, the energy consumption had grown nearly fourfold from 1965 to 2012. The reason: a near doubling of GWP per person, from about $4,000 to around $8,000 (expressed in 1990 US dollars adjusted for price differences among countries). Since the world population and GWP per person are expected to continue their growth, the sharp rise in global energy consumption is also predicted to go on.
You can check the following resources, if you want to see how the world population and the global economy grew in the past few decades:
http://www.census.gov/population/international/data/idb/worldpopgraph.php
http://www.oecd-ilibrary.org/economics/how-was-life_9789264214262-en.
We conclude this overview of the world’s energy requirements with an illustration that presents a breakdown of the total global energy usage by six regions recorded in 1995 and 2012, respectively, and forecast for 2035.
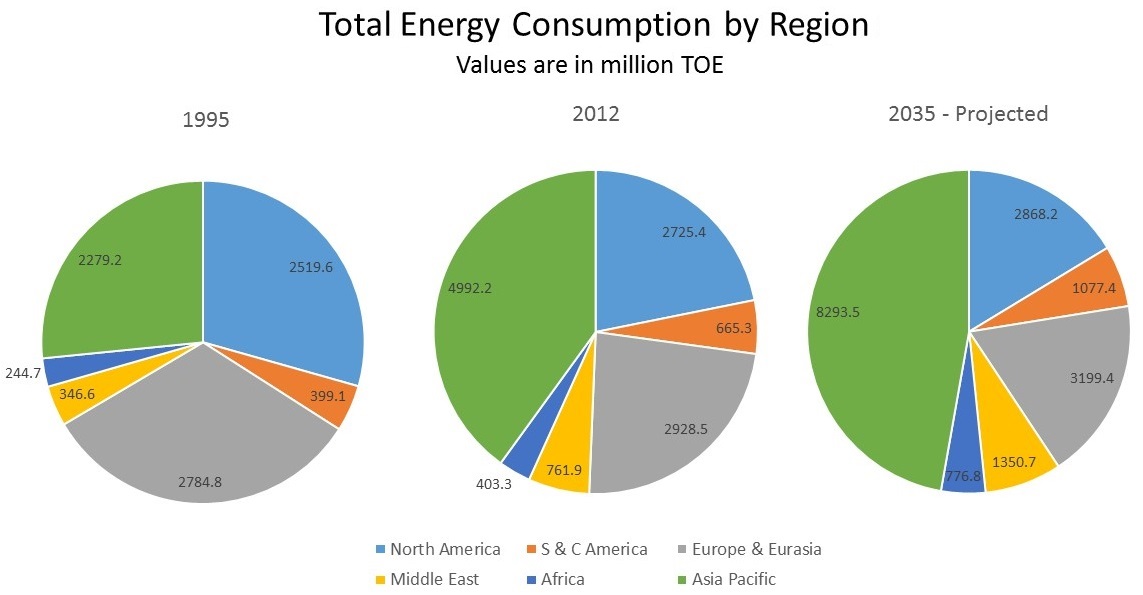
In 1995, Eurasia was the world’s leading consumer of energy, followed closely by North America. In 2012, however, those two regions were far surpassed by the Asia Pacific, which more than doubled its energy consumption relative to the situation in 1995. Africa, Central and South America and the Middle East also increased their individual energy usage considerably between 1995 and 2012, but they still took a rather minor share of the world’s energy pie. They are forecast to continue increasing their consumption of energy significantly without much increase in their usage proportions compared to the other regions. In 2035, Eurasia and North America are anticipated to keep their second and third place, respectively, in the order of the world’s biggest users, but their slices of the energy pie are likely to shrink. Their absolute energy demand is projected to increase only very modestly in the next two decades, while the Asia Pacific is predicted to grow its energy consumption greatly, to nearly 50% of the world’s total.